After the survey closed, I wrote a blog post highlighting details on the planning of Route 100 and reflected the on the results of a survey done in 2011 by Aalborg Municipality. In this post I promised follow-up posts comparing our survey results to the results from 2011. Before delve into the results, I first would like to spend some time dissecting profile of users who responded to our survey. However, before I do that…some notes on the survey itself…
Qualitative Interpretation
One very important thing to note is that, although our survey results provide quantitative figures, we consider this to be a qualitative analysis. When we began this project, we were entirely unable to determine who the user population is. According to CIVITAS and Aalborg Municipality documentation, the intended users are students at Aalborg University - but these cannot be the only individual using the route. In order for the results of our survey to be considered statistically significant, we would need to know the total population we are surveying…but the challenge of knowing who all the possible Route 100 users precluded this possibility for our project. Accepting that our results are not statistically significant, I present the initial findings from our survey as qualitative interpretations to our quantitative results.Survey Questions
The online survey included just over 40 questions. Many of the initial questions focused on the users themselves, how familiar they are with the city and the route, as well as when and where they typically use Route 100. Some of the questions we asked repeated questions asked in 2011 survey organized by Aalborg Municipality, focusing in on each initiative implemented with an aim to investigate whether opinions have changed over the last two years. Other questions delved into what motivates and deters respondents from bicycle along Route 100 and in general.This first stab at analyzing the results looks at the first set of questions in an attempt to understand who responded to our survey and consider how their profile may impact how and why they answer further questions.
Who answered our survey?
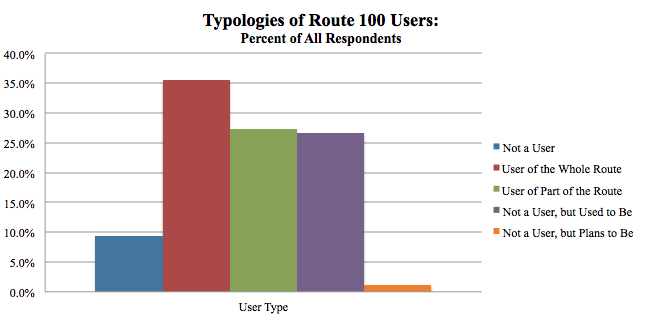
A total of 172 individuals responded to our survey of Route 100. There was a near-even gender split, with 48.8% of respondents being female and 51.2% of respondents being male. Respondents ranged from 20- to 61-years-old, with 56.9% being between 21 and 25-years-old and an average age of 27.In order to understand how different types of users experience Route 100, the remaining initial analysis of the survey results breaks down the users according to whether a respondent:
- Has never been a Route 100 users and does not expect to be (9.3%);
- Is a current Regular user of Route 100 (35.5%);
- Is a current Regular users of a portion of Route 100 (27.3%);
- Used to be a regular user of Route 100 (26.7%) ; or
- Has never been a regular user of Route 100, but plans to be in the future (1.2%).
How Well Do Respondents Know Aalborg?
As we were interested in how familiar respondents are with the city before the Route 100 initiatives were implemented in 2011, the survey asked how long each person has lived within Aalborg Municipality. The majority of respondents have lived in Aalborg Municipality for over five-years and the second most have lived here for two to five years, 39.5% and 33.1% respectively. Of the current regular users, 14% and 14% of those who used to be regular users have lived in the municipality for over five-years. That the largest proportion of respondents have been locals for years, we extrapolate that these are individuals familiar with the area and are may be more comfortable/able to ride in Aalborg than new comers.
When Did Respondents Start Using Route 100?
Very interestingly, the largest proportion of respondents, 39.0%, only began using Route 100 after 2012 and most who started at this time currently are regular Route 100 users. Of those who no longer use the route, the largest proportion of riders who began using the route from 2000 to 2010 and during 2011. This is particularly interesting, as the Route 100 initiatives were completed during 2011. It is highly unlikely that the initiatives themselves had anything to do with respondents ending their use of the route. Luckily for us, we asked why they quit using the route and this is something I plan to take a closer look at in my next round of analysis.
Are Respondents Associated with AAU?
A primary assumption of this project and survey is that the majority of regular users of Route 100 are associated with Aalborg University as students, staff, or faculty. This assumption is based on the alignment of the route, as it provides a connection to the university and is given the name "Universitetsruten" (The University Route). Moreover, a purpose in pursuing this project stated in CIVITAS documents by Aalborg Municipality is to encourage more students to commute to campus by bicycle. Cementing this concept, the Municipality hosted an inaugural event with Aalborg University when the route was officially 'open'.Confirming that the assumption is on track and the goal to provide a facility for individuals commuting to the university, 68% of respondents stated they are students at Aalborg University and 27.6% work for the university. Of the student population of respondents, 26.2% are regular users, 20.3% regularly use a portion of the route, and another 15.1% have stopped using the route but used to be regular users.

Why are Respondents Using Route 100?
Just as the vast majority of most respondents students at Aalborg University, 56.4% of respondents indicated that they use Route 100 to commute to school. The second most common reason, cited by 23.3% of respondents, is th commute to work. The majority of commutes to school and to work are use the entire route, accounting for 20.9% and 9.3% of respondents respectively. A total of 7% of survey respondents stated that they use the Route 100 to visit friends or family and an even smaller 2.9% use the route to shop. Based on the survey results, it is exhibited that the primary reason that most individuals select to use the route is to engage in necessary activities, such as commuting to school or work. Although some are using the route for recreation and exercise, the proportion that these optional activities is shadowed by the number of riders using Route 100 for particle purposes.
When and How Often Do Respondents Use Route 100?
The largest proportion of regular users of the whole route and part of the route, 29.1% and 17.4% respectively, are using the route between 2 and 5 days each week. That most users are riding Route 100 from 2 to 5 days each week is in line with the indication that most respondents are students who are commuting to school. A total of 48.3% of respondents use the route this much, with another 21.5% who use the route rarely. Not surprisingly, it is the former regular riders who answered that they now rarely use the route and all of those who are no longer users, but used to be, all responded that they have stopped using the route.
Just as most respondents are commuting to work or commuting to school, the two times during the day that Route 100 is used are from 7:00 to 9:00 and from 15:00 to 18:00. A total of 74.4% and 72.7% of respondents using the route at these times respectively. Those who are regularly riders of the route make up the majority of users during both periods, with partial users accounting for the second largest proportion of users during these peak periods.

Most riders are using Route 100 throughout the year, although there is a small dip during the winter months. Only 75% of survey respondents indicated that they use Route 100 during the winter and 90.7% are using the route for the other three seasons of the year. This drop in ridership during the colder, icier, snowier part of the year will be further investigated when i look at what motivates and deters respondents from riding their bicycle on Route 100 and in general.

Check Back!
Now that I'm starting to understand who our respondents are, why they use the facility, and when they are traveling on Route 100…I'll shortly move on to delving into the "more interesting" elements of our online survey. Soon I will write about where different riders enter and exit the route as well as how long respondents typical bicycle riders are when using Route 100 and how long they are on the route itself. They survey also asked users which types of facilities they prefer, which I will discuss along with how they feel about Aalborg as a City for Bicyclists in general.
There are also the questions linking our survey up to the 2011 evaluation done by Aalborg Municipality and further questions about route users motivations and deterrents…these topics will be addressed in further upcoming posts...
No comments:
Post a Comment