- Has never been a Route 100 users and does not expect to be (9.3%);
- Is a current Regular user of Route 100 (35.5%);
- Is a current Regular users of a portion of Route 100 (27.3%);
- Used to be a regular user of Route 100 (26.7%) ; or
- Has never been a regular user of Route 100, but plans to be in the future (1.2%).
 |
| (10/2013 | Route 100 in Sections | Credit: Cat Silva) |
Breaking it Down into Sections
This research project distinctly recognizes that many cyclists using of Route 100 are no exclusively using this route on their ride. The reason for believing this is that the facility is permeable and accessible to any rider at nearly all points along the route. Moreover, the route makes a five-kilometer diagonal cut through the city and it is entirely possible that many riders may not enter and exit Route 100 at the route's fixed endpoints. To understand the patterns of how riders are using the route, where common entry and exit points, and which portions of the route respondents enjoy, our survey divides the route into five sections. The five sections were divided at major crossing points along the route and are shown on the map below, which was also included within the survey.In Which Sections are Respondents Entering and Exiting?
Most respondents are doing exactly what Aalborg Municipality planned when implementing Route 100: entering in the City Centre and riding to Aalborg University where they exit. Of all respondents, 30.8% enter in Sections A and 64.5% exit in Section E. That the percent exiting in Section E is so much higher may be attributed to the 20.9% of respondents entering in Section B and 18.6% entering in Section C.
A total of 16.9% of regular users enter the route in Section A, the largest proportion of this user group. Another 6.4% of regular users enter in Section B and 3.5% enter in Section C. The second largest proportion, 7%, are entering near the university in Section E. Most of the regular users who only use a portion of Route 100 enter the Route either in Section B, C, or D. Within in this user group, 8.1% enter in Section C and 7% enter in Sections B and D respectively. The largest proportion of former regular riders enter in Sections A, B and C and 17.4% used to exit the route in Section D.
Very interestingly, the exit pattern is much less spread than the entrance pattern. As stated, 64.5% of respondents exit in Section E and another 17.4% exit in Section A. Only 14.5% or respondents exit Route 100 exit anywhere along the route besides the two end points. As part of our research, we are thinking about what Route 100 affords to users. This does indeed indicates that the route does serve the commute purposes intended by the Municipality. A portion of our research is considering whether the route affords any auxillary experiences to the commute itself. That these results indicate that respondents are not using the route to access other destinations along the route will be further explored as we continue our research of the route's purpose.
How Long are Typical Bicycle Rides?
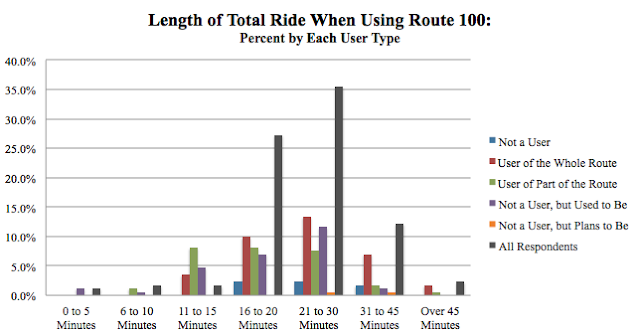
In line with the recognition that riders use different parts of Route 100, we also assume that riders are likely using the route as a portion of their longer ride. As such, we asked respondents how long their entire ride typically is when they use Route 100, and how long they are actually riding on the route itself. Most survey respondents indicated that their entire ride takes 21 to 30 minutes or 16 t 20 minutes, 35.5% ad 27.3% of respondents respectively. The third most comment ride length is from 21 to 45 minutes, accounting for 12.2% of respondents. A very small portion indicated that their ride is shorter than 10 minutes and a similarly small number have a commute longer than 45 minutes.
Once on Route 100, most respondents are riding from 11 to 15 minutes or 16 to 20 minutes, 30.8% and 32% respectively. A slightly smaller portion, 19.2% of respondents are riding on the route for over 20 minutes.
Are Riders Safe on Route 100?
In our survey, one method we had for determining how safe Route 100 is was to ask respondents if they have been in an accident and where that accident took place. Wonderfully, very few respondents reported having been in an accident along Route 100, with 85.5% reporting that they have not had an accident on the route. In total, only 18 respondents indicated that they have been in an accident.
Regular riders of Route 100 were the most common user group reporting an accident, with 13.3% of these users responding that they been in an accident. It is logical that these users have the highest frequency of accidents along the route, as they use the route the most. Likewise, the respondents regularly using part of the route have the next highest incidence of accidents and former regular riders have the third highest rate.
Of those respondents who have been in an accident, Section D is the location where most have occurred. A total of 44.4% of all accidents reported by respondents occurred in this section, with another 27.7% of reported accidents occurring in Section E. Absolutely no accidents were reported in Section B through our survey. It will be interesting to compare these accident results to the results of where respondents enjoy using Route 100. Do riders enjoy the portions that fewer accidents have occurred, or are the more dangerous sections also the most enjoyable?


No comments:
Post a Comment