Saturday, January 4, 2014

Route 100 Survey…Preferences

Today I am continuing my discussion and preliminary analysis of the Route 100 user survey for my research project in Aalborg. In my last two posts, I introduced results of the survey by discussing the users and the use of the route.

In this post I will focus on where respondents Enjoy Riding and what type of infrastructure respondents Prefer Using. Using the same set of sections described my last post, respondents were asked where they enjoy their ride along Route 100. Then, they were shown images of five main infrastructure typologies used along the route and asked to indicate which (one or many) they prefer using when riding a bicycle. As will be noted near the end of the post, this particular analysis will not be complete until we have a completed map of where different types of infrastructure are provided along the route…this post aims to delve into this discussion and begin to think about how preferences are impacted by enjoyment, safety, etc.

Where do Respondents Enjoy Riding?

Based on the same five sections, 28.5% of respondents enjoy riding on Section E the most. Another 22.1% find Section C the most enjoyable. This trend is true both for regular users of the entire route and those who only use a portion of Route 100. The fewest number of respondents, 4.1%, enjoy riding in Section A. This trend is similar for all types of users and is more highlighted among those using the entire length of Route 100. The primary difference between section A and E is that the former is comprised of shared roadways and some grade-separated bicycle lanes and the later is a system of off-street paths.

For clarity, a map of the sections of Route 100 is provided below. See my most recent post on the sections for brief details on the different sections and where survey respondents typically use the route.

(10/2013 | Route 100 in Sections | Credit: Cat Silva)

What Infrastructure Typologies do Respondents Prefer?

As we further analyze the results of the survey, we will detail more clearly what type of bicycle infrastructure are located within each defined section. In order to best investigate why certain sections are more and less enjoyable to respondents, the survey asked what infrastructure bicyclist prefer. These results will be related back to which sections of the route are more and less enjoyable. In addition to the type of infrastructure, this research project will also address where the new Route 100 initiatives are located and add this to the puzzle.

The survey and this research project focuses on the five types of bicycle infrastructure provided along Route 100. These typologies do not all provide the same function nor are they necessarily replacements for one another. Focusing on these five types of infrastructure is intended to help determine if Route 100 riders have a higher or lower preference for any particular typology. The five types are:
  • Shared Roadway (usually, with no markings)
  • Blue Bicycle Lane (located within intersections)
  • At-Grade Bicycle Lane (with no physical barrier, on the roadway or roadway shoulder)
  • Grade-Separated Bicycle Lane (also known as cycle track)
  • Off-Street Path (shared with pedestrians)

Within the survey, respondents were provided with an image of each of the five defined typologies and were asked to indicate which they prefer using, allowing respondents to indicate none or all. The grade-separated bicycle lane and off-street paths are by far the two most preferred types of infrastructure. In the remainder of this post, I will present the image used in the survey and describe the results. This discussion will bring in some of the commentary we received during post-survey interviews we have done with respondents volunteering their time to our research project.

The Shared Roadway

An overwhelming 97.7% of all respondents dislike shared roadway infrastructure. The shared roadway is located in Section A, along the City Centre portion of Route 100. Just as this section is the least enjoyed, this type of infrastructure is the least preferred among respondents. Only a tiny total of three respondents indicated that they like this type of facility. Not a single respondent who used to be a regular Route 100 user and those who currently use a portion of the route.

(July 2009 | Shared Roadway on Nytorv along  Route 100 | Credit: Google Street View)
The image (below) shown in the survey is along a confusing stretch where there is little indication of where the bicycle should be riding. Unlike in the United States, there are no "sharrows" (shared lane pavement markings) indicating that bicyclists have equal access to the road nor where they should ride. Although I am appalled by the idea that stamping a "sharrow" on the ground in the same as providing a facility, I do believe this method is superior to a roadway without any clear indication of where the bicyclists should be.

(10/12/2013 | Shared Roadway Image on Østerbro used in Route 100 Survey | Credit: Franziska T.)
During our post-survey interviews, we asked our interviewees where they felt bicyclists should be riding on this stretch. Some indicated that they ride on the asphalt with traffic. These individuals often noted that they felt unsafe being with the cars, but it feels like the safest option because the cars are forced to slow down and are more aware of their presence. Others  believe that they are meant to ride on the concrete slabs (where the bicyclist is in the photo below), but noted that the space is far too narrow. Still others felt they should be up on the sidewalk, but that they preferred to be on the street because it can be just as unsafe to ride alongside pedestrians. Interestingly, however, looking at this same location on Google Street View from 2009 shows that this stretch of road provided bicyclists a grade-separated lane.

(July 2009 | Grade Separated Bicycle Lanes on Østerbro | Credit: Google Street View)
The changes, while attractive, effectively makes this portion of the route an unmarked shared roadway 
Upgrade paving materials, bollards, and colored paint made the street itself more attractive, but this entirely distracts from the intended functionality of the infrastructure. Riders are required to exert extra effort to figure out where they 'should be' and where they feel the safest. Had the these particular upgrades not occurred, the street would be more ideal for bicyclists instead of becoming the less preferred shared roadway.

The Blue Bicycle Lane

A blue bicycle lane is a type of infrastructure comprised a strip of blue paint, which is the same width as a bicycle lane, drawn across an intersection. This blue paint can be seen throughout Denmark and the same concept is found in an array of different colors around the world. In fact, one of my first blog posts was comprised of my excited ramblings about a green bicycle lane installed around the corner from my home in Seattle. The primary purpose of installing colored paint across intersections is to signal to all road users where bicycle riders can, should, and could be when crossing a street. 
This infrastructure directs bicycle traffic safely across the intersection, and clearly indicates to riders where they should be - i.e., not on the crosswalk and not riding with vehicular traffic. The paint also alerts to drivers that they should be on the look out for bicyclists and to yield to bicycle traffic when attempting to make a right-hand turn across the lane. Moreover, the paint shows bicyclists where they are heading, so they are in the right place to enter the infrastructure provided across the street.

(10/12/2013 | Blue Bicycle Lane Image on Hadsundvej used in Route 100 Survey | Credit: Franziska T.)
Only 17.4% of respondents indicated that they prefer the provision of blue bicycle lanes across intersections. This low number could be explained by the fact that most respondents more thoroughly appreciate other typologies. Or, this result may also indicate that most respondents do not believe these blue lanes add much value to their commute. Of those who do prefer blue bicycle lanes, 73.3% are current regular riders of the entire length of Route 100 and those using only a portion of it. That active bicyclists are those with the strongest preference for this type of infrastructure may further imply that those who prefer blue bicycle lanes are those who regularly interact with and understand the benefits of the painted strip.

(10/12/2013 | No Blue Bicycle Lane at Route 100 Roundabout | Credit: Franziska T.)
The legibility and safety elements that a blue bicycle lane can provide may help new or fearful riders feel more comfortable when crossing any intersection. That said, what is interesting along Route 100 is that blue bicycle lanes are not provided at every crossing. No blue paint is provided at the two roundabouts on Riishøjvej. This may be due to space limitations, but no indication of where bicyclists should be while in the roundabout effectively makes these intersections shared roadways. Even more interesting, no blue bicycle lanes are provided at Bonnesensgade or Fynensgade where bicyclists are given the right of way. Supplying a blue lane across these intersections would be particularly beneficial for Route 100, as it would further enhance bicycle mobility and visibility at these crossings. Perhaps if this intersection infrastructure were provided at more major points along Route 100, more respondents would prefer or appreciate the provision of blue bicycle lanes.

(10/12/2013 | No Blue Bicycle Lane at Route 100 Improved Intersection | Credit: Franziska T.)

The Bicycle Lane

A bicycle lane is an area of the roadway dedicated to bicyclists, demarcated by a painted line on the ground. This type of infrastructure is located at-grade with surface traffic, typically adjacent to the sidewalk. Bicycle lanes are often stamped with bicycle pavement markings indicating to all road users that the lane is for bicycle riders. Similar to the blue lanes across intersections, bicycle lanes provide a clear indication of where bicyclists should ride on the road and other road users must yield to bicyclists when crossing the lane. As is shown in the photo below, the lane marking may change from solid to dashed at driveways or side streets where vehicles must cross the bicycle lane in order to enter regular traffic. This change lets riders know to be more cautious and lets drivers know they have the right to cross the lane at this point. Aside from these locations, bicycle lanes should only be used by bicyclists and meant to provide a safe zone for riders on the road.

(10/12/2013 | Bicycle Lane on Route 100 | Credit: Franziska T.)
Much more popular than riding along with cars on shared roadways, bicycle lanes are preferred by 31.4% of all survey respondents. The largest base of users who prefer this typology are regular riders of Route 100, but only 39.3% of these users listed bicycle lanes as a preference. As I will discuss in the following sections, the reason that more riders do not prefer bicycle lanes may be the limited safety they provide compared to the two remaining types of infrastructure provided along Route 100.

The Grade-Separated Bicycle Lane

Far preferred to shared roadways and twice as desirable as bicycle lanes, 77.3% of respondents indicated that they appreciate the provision of grade-separated bicycle lanes. The primary difference between this typology and the standard bicycle lane is that the infrastructure is usually raised slightly above street around the same height as the sidewalk. Unlike the painted strip on ground, a physical separation and curb prevents motor vehicles from encroaching or stopping in the bicycle lane.
(10/12/2013 | Grade-Separated Bicycle Lane on Route 100 | Credit: Franziska T.)
A total of 70.4% of regular Route 100 users prefer grade separation. This higher percentage may be due to the fact that this typology provides a higher degree of safety via the vertical physical barrier from regular roadway traffic. This may also be a more preferred type of infrastructure as it exhibits a distinct investment in bicycling as a mode of transportation, which may make riders feel more accepted and equal to motorized road users. Very interestingly, it was also the regular Route 100 users that indicated they do not like grade separation facilities, accounting for 17.8% of those not preferring this typology. Although there are benefits of grade separation, this type of infrastructure limits roadway capacity for bicycles. When standard bicycle lanes are provided, riders can easily pass slower riders and/or cargo bikes ahead of them. 

(10/12/2013 | Grade-Separated Bicycle Lane on Nytorv on Route 100 | Credit: Franziska T.)
The grade-separated  bicycle lanes inhibit such movements and can potentially slow down speedy riders. Another potential difficulty riders face is at bus stops, where boarding and alighting passengers cross over the bicycle's lane. Depending on how aware the bicyclists or pedestrian is of their surroundings, this modal interaction may be dangerous. There is also added conflict with pedestrians when there is no grade separation between the lane and the sidewalk. While riders are safer from motorized vehicles, pedestrians do not always understand the subtle indication of a bicycle lane and may use the space as an extended sidewalk.

The Off-Street Path

Off-street paths are shared among all non-motorized modes of transportation. This type of infrastructure is typically located adjacent to or away from motorized roadways. When the path is adjacent to the road, sizable physical barrier is often in place, with bollards or stanchions preventing vehicles from entering the path. Lane striping often exists, indicating two-way use or with one side meant for pedestrians and the other for bicyclists. 
(10/12/2013 | Off-Street Path Lane Markings on Route 100 | Credit: Franziska T.)
These paths can be singular facilities connecting two particular points or may be a part of a larger network of shared use paths or other local trails. The latter is true for the path that Route 100. In Section E of our map, a system of off-street paths from the local area connect together and bleed into Aalborg University's campus. Riders and walkers coming from different directions merge and disperse on the way to their respective destinations. Wayfinding is provided at decision points and users are instructed through signage that the paths are two-way streets. Generally, the design of this path system is effective, but one major flaw with the off-street path that Route 100 uses is how it ends. The path suddenly deposits riders onto a two-way road that users must cross without a formal crossing provided. Once crossing the street, the gateway onto the university campus is a parking lot where bicyclists and pedestrians must cautiously make their way to safety.

(10/12/2013 | End of Route 100 at Aalborg University | Credit: Franziska T.)
Slightly higher than the results for grade-separated bicycle lanes, 81.9% of regular Route 100 users prefer off-street bicycle paths and making this the most preferred typology among these users. It is respondents who only use a portion of Route 100 that find off-street paths the least favorable, but there are still 67.3% of these users who prefer this typology. Overall, 70.9% of survey respondents indicated that they prefer using off-street paths. This makes off-street paths the second most favorable infrastructure, second only to grade-separated bicycle lanes. 

(10/12/2013 | Tunnel on the Off-Stret Path on Route 100 | Credit: Franziska T.)
During our post-survey interviews, several individuals stated that the system of paths by Aalborg University is the only place where they are surrounded by green vegetation - making this a more pleasant portion of the route to ride on. However, our interviews also highlighted that a tunnel that riders must go through can be an unsafe place to ride. Lighting is limited in the tunnel and sharp turns at the entrance and exit has the potential to cause collusions. The second highest incidence of accidents reported through the survey occurred in the section where off-street paths are used. That noted, Section E remains to be the most enjoyed by respondents and off-street paths the second most preferred typology among survey respondents. 

Next Step in Preferences vs Enjoyment

Because Section E is comprised only of off-street paths, it is easy to mull over this paradox. The other sections, however, are made up of several types of infrastructure which makes it more difficult to determine if enjoyment and safety are linked or antithetical to rider preferences. As we more clearly map out where different types of infrastructure are provided along Route 100, this discussion will be continued. Furthermore, this line of thinking will be connected back to our research questions and I will be begin to consider how preferences and enjoyment influence what Route 100 affords and prevents to users.

Check Back!

Next a coming post, I plan to reflect on the results of Aalborg Municipality's evaluation of the seven Route 100 Initiatives implemented as a part of the CIVITAS project. In a previous post, I discussed each of the initiatives and the results of a survey done by the Municipality in 2011. Our survey repeated identical questions and I will review if opinions have changed for better or worse in the two years since the initial survey was undertaken.
In following posts, I will begin to look at the results of what motivates survey respondents to use their bicycles as well as what deters them. These motivations and deterrents will loop back into the current discussion of enjoyment, as these results may likely link into which typologies and route sections are more appealing to Route 100 users.

Saturday, December 21, 2013

Route 100 Survey…The Sections

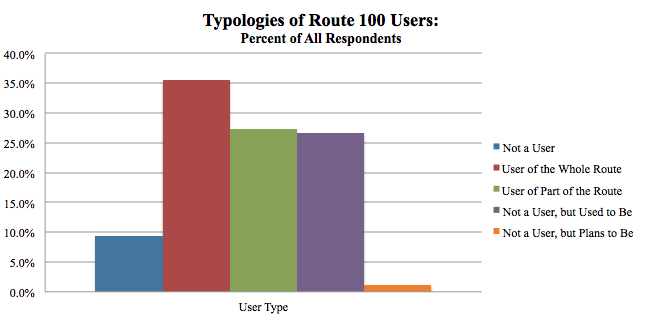
In my last post, I begin my analysis of the results of my research project's online survey on Route 100. This first look at the survey results was focused on understanding and describing the general profile of those individuals who responded to the survey. I now continue my analysis of the results, still broken down and discussed according to on they type of user. A a reminder, these types are:
  1. Has never been a Route 100 users and does not expect to be (9.3%);
  2. Is a current Regular user of Route 100 (35.5%);
  3. Is a current Regular users of a portion of Route 100 (27.3%);
  4. Used to be a regular user of Route 100 (26.7%) ; or
  5. Has never been a regular user of Route 100, but plans to be in the future (1.2%).
(10/2013 | Route 100 in Sections | Credit: Cat Silva)

Breaking it Down into Sections

This research project distinctly recognizes that many cyclists using  of Route 100 are no exclusively using this route on their ride. The reason for believing this is that the facility is permeable and accessible to any rider at nearly all points along the route. Moreover, the route makes a five-kilometer diagonal cut through the city and it is entirely possible that many riders may not enter and exit Route 100 at the route's fixed endpoints. To understand the patterns of how riders are using the route, where common entry and exit points, and which portions of the route respondents enjoy, our survey divides the route into five sections. The five sections were divided at major crossing points along the route and are shown on the map below, which was also included within the survey.

In Which Sections are Respondents Entering and Exiting?

Most respondents are doing exactly what Aalborg Municipality planned when implementing Route 100: entering in the City Centre and riding to Aalborg University where they exit. Of all respondents, 30.8% enter in Sections A and 64.5% exit in Section E. That the percent exiting in Section E is so much higher may be attributed to the 20.9% of respondents entering in Section B and 18.6% entering in Section C. 

A total of 16.9% of regular users enter the route in Section A, the largest proportion of this user group. Another 6.4% of regular users enter in Section B and 3.5% enter in Section C. The second largest proportion, 7%, are entering near the university in Section E. Most of the regular users who only use a portion of Route 100 enter the Route either in Section B, C, or D. Within in this user group, 8.1% enter in Section C and 7% enter in Sections B and D respectively. The largest proportion of former regular riders enter in Sections A, B and C and 17.4% used to exit the route in Section D.
Very interestingly, the exit pattern is much less spread than the entrance pattern. As stated, 64.5% of respondents exit in Section E and another 17.4% exit in Section A. Only 14.5% or respondents exit Route 100 exit anywhere along the route besides the two end points. As part of our research, we are thinking about what Route 100 affords to users. This does indeed indicates that the route does serve the commute purposes intended by the Municipality. A portion of our research is considering whether the route affords any auxillary experiences to the commute itself. That these results indicate that respondents are not using the route to access other destinations along the route will be further explored as we continue our research of the route's purpose.

How Long are Typical Bicycle Rides?

In line with the recognition that riders use different parts of Route 100, we also assume that riders are likely using the route as a portion of their longer ride. As such, we asked respondents how long their entire ride typically is when they use Route 100, and how long they are actually riding on the route itself. Most survey respondents indicated that their entire ride takes 21 to 30 minutes or 16 t 20 minutes,  35.5% ad 27.3% of respondents respectively. The third most comment ride length is from 21 to 45 minutes, accounting for 12.2% of respondents. A very small portion indicated that their ride is shorter than 10 minutes and a similarly small number have a commute longer than 45 minutes.
Once on Route 100, most respondents are riding from 11 to 15 minutes or 16 to 20 minutes, 30.8% and 32% respectively. A slightly smaller portion, 19.2% of respondents are riding on the route for over 20 minutes.

Are Riders Safe on Route 100?

In our survey, one method we had for determining how safe Route 100 is was to ask respondents if they have been in an accident and where that accident took place. Wonderfully, very few respondents reported having been in an accident along Route 100, with 85.5% reporting that they have not had an accident on the route. In total, only 18 respondents indicated that they have been in an accident.

Regular riders of Route 100 were the most common user group reporting an accident, with 13.3% of these users responding that they been in an accident. It is logical that these users have the highest frequency of accidents along the route, as they use the route the most. Likewise, the respondents regularly using part of the route have the next highest incidence of accidents and former regular riders have the third highest rate.

Of those respondents who have been in an accident, Section D is the location where most have occurred. A total of 44.4% of all accidents reported by respondents occurred in this section, with another 27.7% of reported accidents occurring in Section E. Absolutely no accidents were reported in Section B through our survey. It will be interesting to compare these accident results to the results of where respondents enjoy using Route 100. Do riders enjoy the portions that fewer accidents have occurred, or are the more dangerous sections also the most enjoyable?

Check Back!

In my next post I will look at the results of what types of bicycle facilities respondents prefer and discuss which sections of the route are most enjoyable to riders. After this brief discussion, I will begin to delve into what motivates and deters riders from using their bicycles.

Thursday, December 19, 2013

Route 100 Survey…Respondents

From November 11th to December 13th, my research partner and myself implemented an online survey targeted at bicyclists using of Route 100 in Aalborg, Denmark. I announced the survey on this blog last month, asking anyone who has used the bicycle route once or commutes on it regularly to respond and help our research effort. We advertised the survey to Aalborg University students in every department via email, posted messages on over 20 Facebook pages, and handed out over 900 flyers along the route and at in university buildings.

After the survey closed, I wrote a blog post highlighting details on the planning of Route 100 and reflected the on the results of a survey done in 2011 by Aalborg Municipality. In this post I promised follow-up posts comparing our survey results to the results from 2011. Before delve into the results, I first would like to spend some time dissecting  profile of users who responded to our survey. However, before I do that…some notes on the survey itself…

Qualitative Interpretation

One very important thing to note is that, although our survey results provide quantitative figures, we consider this to be a qualitative analysis. When we began this project, we were entirely unable to determine who the user population is. According to CIVITAS and Aalborg Municipality documentation, the intended users are students at Aalborg University - but these cannot be the only individual using the route. In order for the results of our survey to be considered statistically significant, we would need to know the total population we are surveying…but the challenge of knowing who all the possible Route 100 users precluded this possibility for our project. Accepting that our results are not statistically significant, I present the initial findings from our survey as qualitative interpretations to our quantitative results.

Survey Questions

The online survey included just over 40 questions. Many of the initial questions focused on the users themselves, how familiar they are with the city and the route, as well as when and where they typically use Route 100. Some of the questions we asked repeated questions asked in 2011 survey organized by Aalborg Municipality, focusing in on each initiative implemented with an aim to investigate whether opinions have changed over the last two years. Other questions delved into what motivates and deters respondents from bicycle along Route 100 and in general.

This first stab at analyzing the results looks at the first set of questions in an attempt to understand who responded to our survey and consider how their profile may impact how and why they answer further questions.

Who answered our survey?

A total of 172 individuals responded to our survey of Route 100. There was a near-even gender split, with 48.8% of respondents being female and 51.2% of respondents being male. Respondents ranged from 20- to 61-years-old, with 56.9% being between 21 and 25-years-old and an average age of 27.

In order to understand how different types of users experience Route 100, the remaining initial analysis of the survey results breaks down the users according to whether a respondent:
  1. Has never been a Route 100 users and does not expect to be (9.3%);
  2. Is a current Regular user of Route 100 (35.5%);
  3. Is a current Regular users of a portion of Route 100 (27.3%);
  4. Used to be a regular user of Route 100 (26.7%) ; or
  5. Has never been a regular user of Route 100, but plans to be in the future (1.2%).

How Well Do Respondents Know Aalborg?

As we were interested in how familiar respondents are with the city before the Route 100 initiatives were implemented in 2011, the survey asked how long each person has lived within Aalborg Municipality. The majority of respondents have lived in Aalborg Municipality for over five-years and the second most have lived here for two to five years, 39.5% and 33.1% respectively. Of the current regular users, 14% and 14% of those who used to be regular users have lived in the municipality for over five-years. That the largest proportion of respondents have been locals for years, we extrapolate that these are individuals familiar with the area and are may be more comfortable/able to ride in Aalborg than new comers.

When Did Respondents Start Using Route 100?

Very interestingly, the largest proportion of respondents, 39.0%, only began using Route 100 after 2012 and most who started at this time currently are regular Route 100 users. Of those who no longer use the route, the largest proportion of riders who began using the route from 2000 to 2010 and during 2011. This is particularly interesting, as the Route 100 initiatives were completed during 2011. It is highly unlikely that the initiatives themselves had anything to do with respondents ending their use of the route. Luckily for us, we asked why they quit using the route and this is something I plan to take a closer look at in my next round of analysis.

Are Respondents Associated with AAU?

A primary assumption of this project and survey is that the majority of regular users of Route 100 are associated with Aalborg University as students, staff, or faculty. This assumption is based on the alignment of the route, as it provides a connection to the university and is given the name "Universitetsruten" (The University Route). Moreover, a purpose in pursuing this project stated in CIVITAS documents by Aalborg Municipality is to encourage more students to commute to campus by bicycle. Cementing this concept, the Municipality hosted an inaugural event with Aalborg University when the route was officially 'open'.

Confirming that the assumption is on track and the goal to provide a facility for individuals commuting to the university, 68% of respondents stated they are students at Aalborg University and 27.6% work for the university. Of the student population of respondents, 26.2% are regular users, 20.3% regularly use a portion of the route, and another 15.1% have stopped using the route but used to be regular users.
It should be noted that our survey was the most heavily advertised to the Aalborg University community - via the emails being sent to the staff and students at each department and posted to Facebook groups associated with the university. This means that the finding that most users are associated with the university may be biased, due to how the survey was advertised and may not be entirely reflective of the entire group of users.

Why are Respondents Using Route 100?

Just as the vast majority of most respondents students at Aalborg University, 56.4% of respondents indicated that they use Route 100 to commute to school. The second most common reason, cited by 23.3% of respondents, is th commute to work. The majority of commutes to school and to work are use the entire route, accounting for 20.9% and 9.3% of respondents respectively. A total of 7% of survey respondents stated that they use the Route 100 to visit friends or family and an even smaller 2.9% use the route to shop. Based on the survey results, it is exhibited that the primary reason that most individuals select to use the route is to engage in necessary activities, such as commuting to school or work. Although some are using the route for recreation and exercise, the proportion that these optional activities is shadowed by the number of riders using Route 100 for particle purposes.

When and How Often Do Respondents Use Route 100?

The largest proportion of regular users of the whole route and part of the route, 29.1% and 17.4% respectively, are using the route between 2 and 5 days each week. That most users are riding Route 100 from 2 to 5 days each week is in line with the indication that most respondents are students who are commuting to school. A total of 48.3% of respondents use the route this much, with another 21.5% who use the route rarely. Not surprisingly, it is the former regular riders who answered that they now rarely use the route and all of those who are no longer users, but used to be, all responded that they have stopped using the route.

Just as most respondents are commuting to work or commuting to school, the two times during the day that Route 100 is used are from 7:00 to 9:00 and from 15:00 to 18:00. A total of 74.4% and 72.7% of respondents using the route at these times respectively. Those who are regularly riders of the route make up the majority of users during both periods, with partial users accounting for the second largest proportion of users during these peak periods.
Most riders are using Route 100 throughout the year, although there is a small dip during the winter months. Only 75% of survey respondents indicated that they use Route 100 during the winter and 90.7% are using the route for the other three seasons of the year. This drop in ridership during the colder, icier, snowier part of the year will be further investigated when i look at what motivates and deters respondents from riding their bicycle on Route 100 and in general.

Check Back!

Now that I'm starting to understand who our respondents are, why they use the facility, and when they are traveling on Route 100…I'll shortly move on to delving into the "more interesting" elements of our online survey. Soon I will write about where different riders enter and exit the route as well as how long respondents typical bicycle riders are when using Route 100 and how long they are on the route itself. They survey also asked users which types of facilities they prefer, which I will discuss along with how they feel about Aalborg as a City for Bicyclists in general.

There are also the questions linking our survey up to the 2011 evaluation done by Aalborg Municipality and further questions about route users motivations and deterrents…these topics will be addressed in further upcoming posts...

Monday, December 16, 2013

Mobilities Design in Malmö

Over the weekend, my boyfriend and I took the 30-minute train ride across the Øresund and visited the Swedish City of Malmö for the day. I was hard-pressed to avoid noticing the mobilities designed… 


Malmö Central Station

The wayfinding throughout the station was impressive! The signage is incredibly clear and repeats itself consistently so that passengers entering from each platform can easily find their way as soon as they enter the main corridor.
(12/16/2013 | Wayfinding in Malmö Central Station | Credit: Cat Silva)
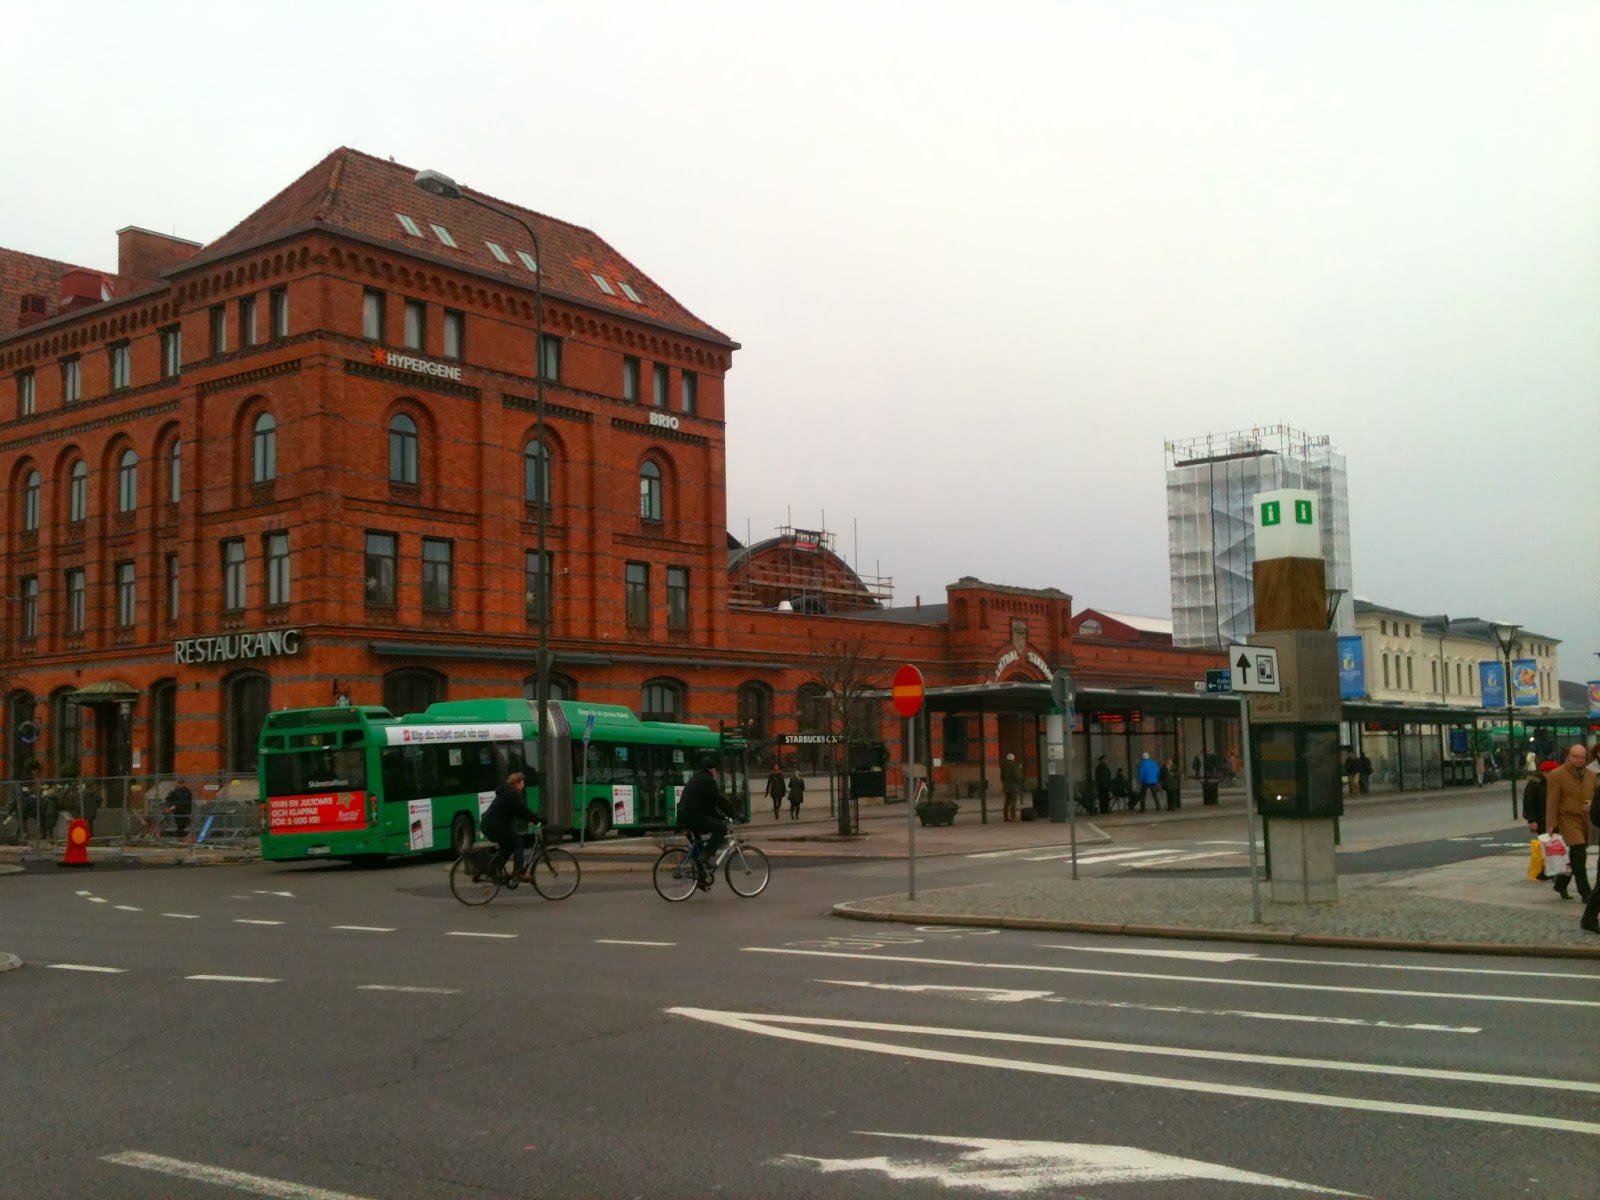
Just outside of the station, intermodal transportation is supported in two primary ways. Individuals existing the station to the West immediately see bicycle parking.
(12/16/2013 | Bicycle Parking at Malmö Central Station | Credit: Cat Silva)
And those existing the station from toward the South come across a bus terminal, completed with shelters and a platform where passengers can wait for their bus connection. Not shown well in this photo, there is also a two-way bicycle track just south of the bus terminal.
(12/16/2013 | Malmö Central Station Bus Terminal | Credit: Cat Silva)

Walking Around

Also common in Denmark, there is signage provided to pedestrians, letting them know when to use the sidewalk and when they have equal rights to use the street. The sign on the left informs pedestrians that they can step off the sidewalk and tells cars that they must yield to non-motorized road users. The diagonal red line on the sign in the photo on the left tells everyone that pedestrians should return to the sidewalk and drivers have priority use of the streets. 


(12/16/2013 | Shared Space Enter/Exit Signage in Malmö | Credit: Cat Silva)

Both along the streets and on paths through the park, bollards have been placed to guide pedestrians around the city. They point to walking paths, distance to destinations, and signs advertising the health benefits f walking.

(12/16/2013 | Pedestrian Wayfinding Bollards in Malmö | Credit: Cat Silva)

Local Bicycle Infrastructure

I found bicycle wayfinding installed in the city centre and along park paths and quite like the look of the signage. Signs are installed at a height visible to riders and pedestrians alike, and the blades are large enough to easily be legible for passers by. The largest downside to these signs is that no distance is printed on the signs.

(12/16/2013 | Bicycle Wayfinding Signage in Malmö | Credit: Cat Silva)

The infrastructure for bicyclists was interesting. At times, riders were on the street and at other times riders are provided off-street paths adjacent to the road.


(12/16/2013 | Malmö Central Station Wayfinding | Credit: Cat Silva)

Along side one bicycle lane that is at the same grade as roadway traffic, bollards are installed to protect bicyclists from passing cars.

(12/16/2013 | Bollards Protect the Bicycle Lane on Malmöhusvägen Malmö | Credit: Cat Silva)

Very interestingly, many of the off-street bicycle paths are two-way paths located - where riders going both directions used the same. In some places, I noticed the same two-way path was on both sides of the road, and in others it was only located on one side. I didn't try riding a bicycle during our visit, but I'm curious how easy it is to figure out when it is one- or two-ways and if it is difficult to know which side of the street to be on.

(12/16/2013 | Two-Way Bicycle Track in Malmö | Credit: Cat Silva)

These two-way paths are separated from the road and share the same space as the sidewalk. Both the pedestrian and bicycle infrastructure is often at the same grade. Despite signage like in the photo on the left and pavement markings like those in the photo on the right, it was not a rare occurrence to see a bicyclist riding on the sidewalk instead of the bicycle infrastructure.

(12/16/2013 | Bicyclists Using Sidewalks in Malmö | Credit: Cat Silva)

Although it was not ubiquitous in the city centre, there were some very quality bicycle parking facilities located in front of some residences in Malmö. In the photo below, the visible parking spots are for the business located in the ground floor of the mixed use buildings, with additional space available behind the stone wall under the shelters.

(12/16/2013 | Residential Bicycle Parking Västra Varvsgatan in Malmö | Credit: Cat Silva)

In the new neighborhood of Bo01, located to the west of the Torso Tower, a nice amenity is provided to locals. Signed with the word "Luft" (air), there s a bicycle air pump located on the north-south portion of Salongsgaten.

(12/16/2013 | Bicycle Air Pump in Bo01 in Malmö | Credit: Cat Silva)

Local Bus System

At major bus stops, like the stop near the Turning Torso Tower, there are fantastic real-time display showing bus arrival times. These signs displays are tall, easy to read, and lets waiting passengers know if they should relax in the shelter or stand ready with their bus pass in hand.

 (12/16/2013 | Turning Torso Bus Stop in Malmö | Credit: Cat Silva)


One small detail we noticed was that the minor bus stop signs display the same green color as the buses themselves. And at this particular stop, notice that there are five bicycle parking spots available, encouraging intermodal transportation!


 (12/16/2013 | Bus Stop on Mariedalsvägen in Malmö | Credit: Cat Silva)

Materiality Designs Mobilities

What struck me the most about the transportation infrastructure in Malmö was the use of different materials to guide individuals through the road network. Of course there was signage and some grade separation, but the city seems to have placed highest weight on using different types of materials and different colored stones to design how the roadways are used. In the photo below, the sign posts and bicycle pavement marking signal that path connecting to the sidewalk is meant for bicyclists. Although there is no physical separation and the sidewalk is at the same grade as the bicycle path, users know which space belongs to the bicyclists because a different type of material is used where pedestrians and bicyclists are meant to be.


(12/16/2013 | Bicycle Track at the Same Grade as Sidewalk in Malmö | Credit: Cat Silva)

In the Bo01 neighborhood, the space that is residential and private is marked with yellow-tinted bricks. Where this neighborhood meets the road, red bricks are used where pedestrians should be and the roadway is paved with darker stones. When crossing from one colored brick to the other, there is a distinct feeling that it is a "different space", as you move from the more private space to the slightly more open and public space outside of the residential core.


(12/16/2013 | Material Divides Space in Malmö | Credit: Cat Silva)

In the city centre, many roads are entirely flat, with no grade separation at all. Cobblestone is used through out the space, but a different pattern is used along the sides where pedestrians should be. The wide stones create a separate space for the pedestrians, with bollards provided at some points to provide additional protection. A bicycle lane is separated from car traffic by the use of a line of darker cobblestones.

(12/16/2013 | No Grade Separation on Roadway in Malmö | Credit: Cat Silva)


This creates a very pleasant feel to the street, as there the materials are used to subtly guide traffic, instead of yellow striping or raised concrete sidewalks. A possible downside could be how legible the use of different materials is. It was difficult to see the bicycle lane strip 50 feet head, and it was unclear if this lane operated as a two-way track or if riders going the opposite direction are meant to share space with the cars. Our theory is that the system is likely a little confusing at first, once you get used to what the different materials mean, the city may become very easy to navigate and enjoyable to use.


Heading Over Øresund

At the end of a day of exploring, we headed back to the Malmö Central Station to catch the train back to Copenhagen. While waiting, rolling images were projected on the walks, giving us something to look at as we waited for the train to arrive.'

(12/16/2013 | Train Platform at Malmö Central Station | Credit: Cat Silva)